


I was afraid of this! High school math was a breeze for me, but of course the first problem on the first assignment of my first college math class has me stumped. I feel like I skipped a whole year of math or something.
I checked the solutions manual for the answer, hoping that I could figure out how to work the problem if I knew for sure what the answer was, but it hasn't really helped me any.
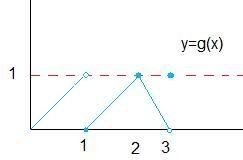
This is the graph:
The problems:
A. lim g(x) as x approaches 1
Answer: Does not exist. As x approaches 1 from the right, g(x) approaches 0. As x approaches 1 from the left, g(x) approaches 1. There is no single number L that all the values g(x) get arbitrarily close to as x approaches 1.
(I think I understand this. Maybe)
B. lim g(x) as x approaches 2
Answer: 1
C. lim g(x) as x approaches 3
Answer: 0
Also, when I say "as x approaches 1" I mean the little arrow pointing from the x to the 1 underneath the word "lim." I understood this symbol correctly, right?
My professor didn't explain anything to us. She asked us to read the book, but I can never understand math when reading from the textbook, even when it's stuff I know well.
Anyway, it would help me a lot if someone could help me figure out how to get to these answers x.x


 Reply With Quote


